Dashboard
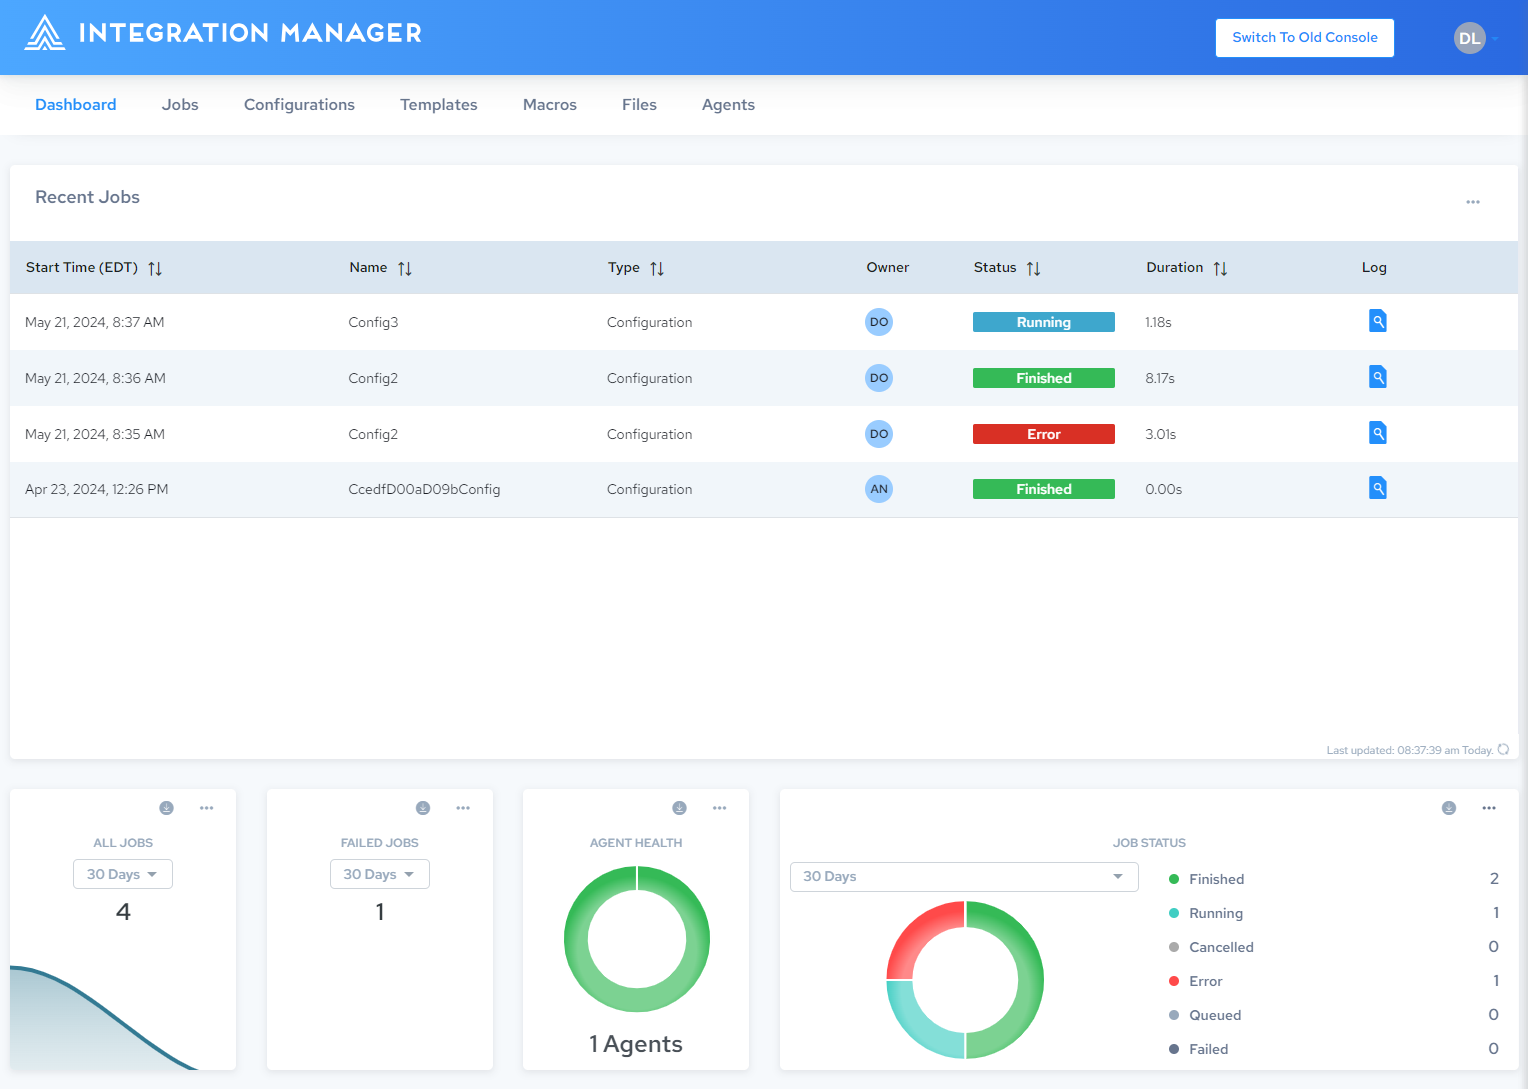
The Dashboard provides data visualization charts that you can use to monitor the overall status of your integrations, configurations, and agents.
Widgets
The following widgets are available on the Dashboard.
For any widget that shows the download icon, click ![]() to download the chart in SVG, PNG, or CSV format.
to download the chart in SVG, PNG, or CSV format.
Recent Jobs
Recent Jobs provides a table of recently-run jobs, and displays details and status for each job. Click the Start, Name, Type, Status, or Duration column headings to toggle between ascending and descending sort order.

Click ![]() to download the log file for that job. See Downloading the Log File.
to download the log file for that job. See Downloading the Log File.
ALL JOBS
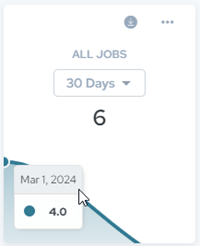
The ALL JOBS chart displays the number of integrations executed for the selected time period (30, 60 or 90 days). Hover over the chart to see the value per day.
FAILED JOBS
The FAILED JOBS chart represents the number of failed integrations executed for the selected time period (30, 60 or 90 days). Hover over the chart to see the value per day.
JOB STATUS
The JOB STATUS chart represents run results status for configuration jobs executed during the selected time period (30, 60 or 90 days).
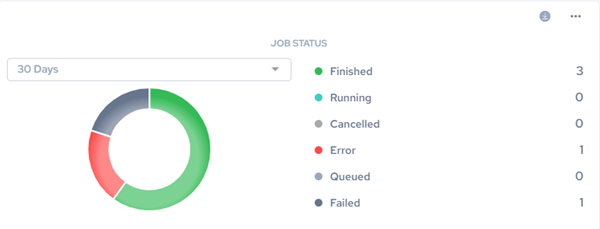
Sync result status can be:
- Finished: Job has successfully completed. A log file is available (or soon will be).
- Running: Job is currently executing on a worker.
- Cancelled: Job was canceled prior to being acquired by a worker (during the Waiting or Queued state). No log file will be produced.
- Error: Job encountered an exception during execution. Depending on configuration and artifact design, the job may or may not have completed. A log file is available (or soon will be).
- Queued: Job has been queued for execution by the next available worker.
- Failed: Job failed or was manually stopped by user command or exception at some point during initialization or execution. A log file may or may not be available.
AGENT HEALTH
The AGENT HEALTH chart represents the health status of agents a user has installed. In the following figure, the user has one agent installed and its status is Finished. Hover over the chart to see the value per day.
Agent status can be:
- Healthy: The agent is connected and ready to receive jobs.
- Warning: The Agent has not reported its status in over 3 hours and may require attention.
- Error: The Agent has not reported its status in over 6 hours.
- Updating: The Agent is currently processing an Update Command, such as Update Worker or Update Engine.
- Offline: The Agent is offline or the local service is stopped. This status is typically reported just prior to a shutdown.
You can verify whether the agent is running, and also start the agent service, by opening Windows Services.
Customizing the Dashboard
Adding and Removing Widgets
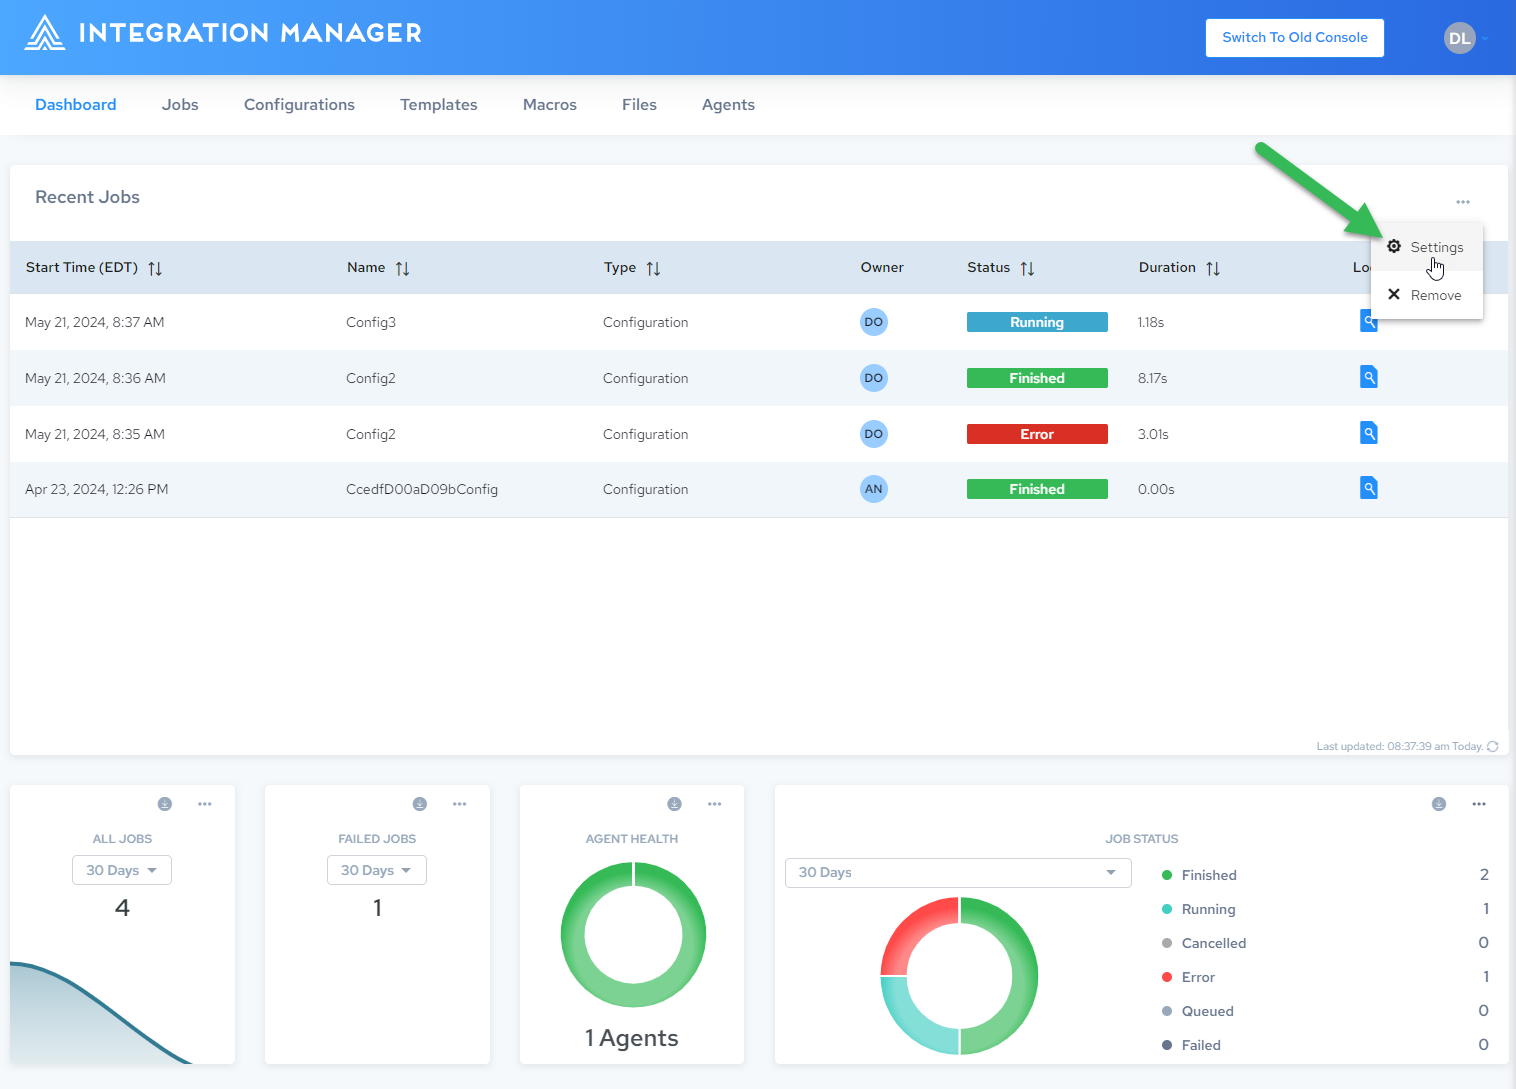
To add or remove a widget, do the following:
-
Click
 in the upper right corner of any dashboard widget and select Settings:
-
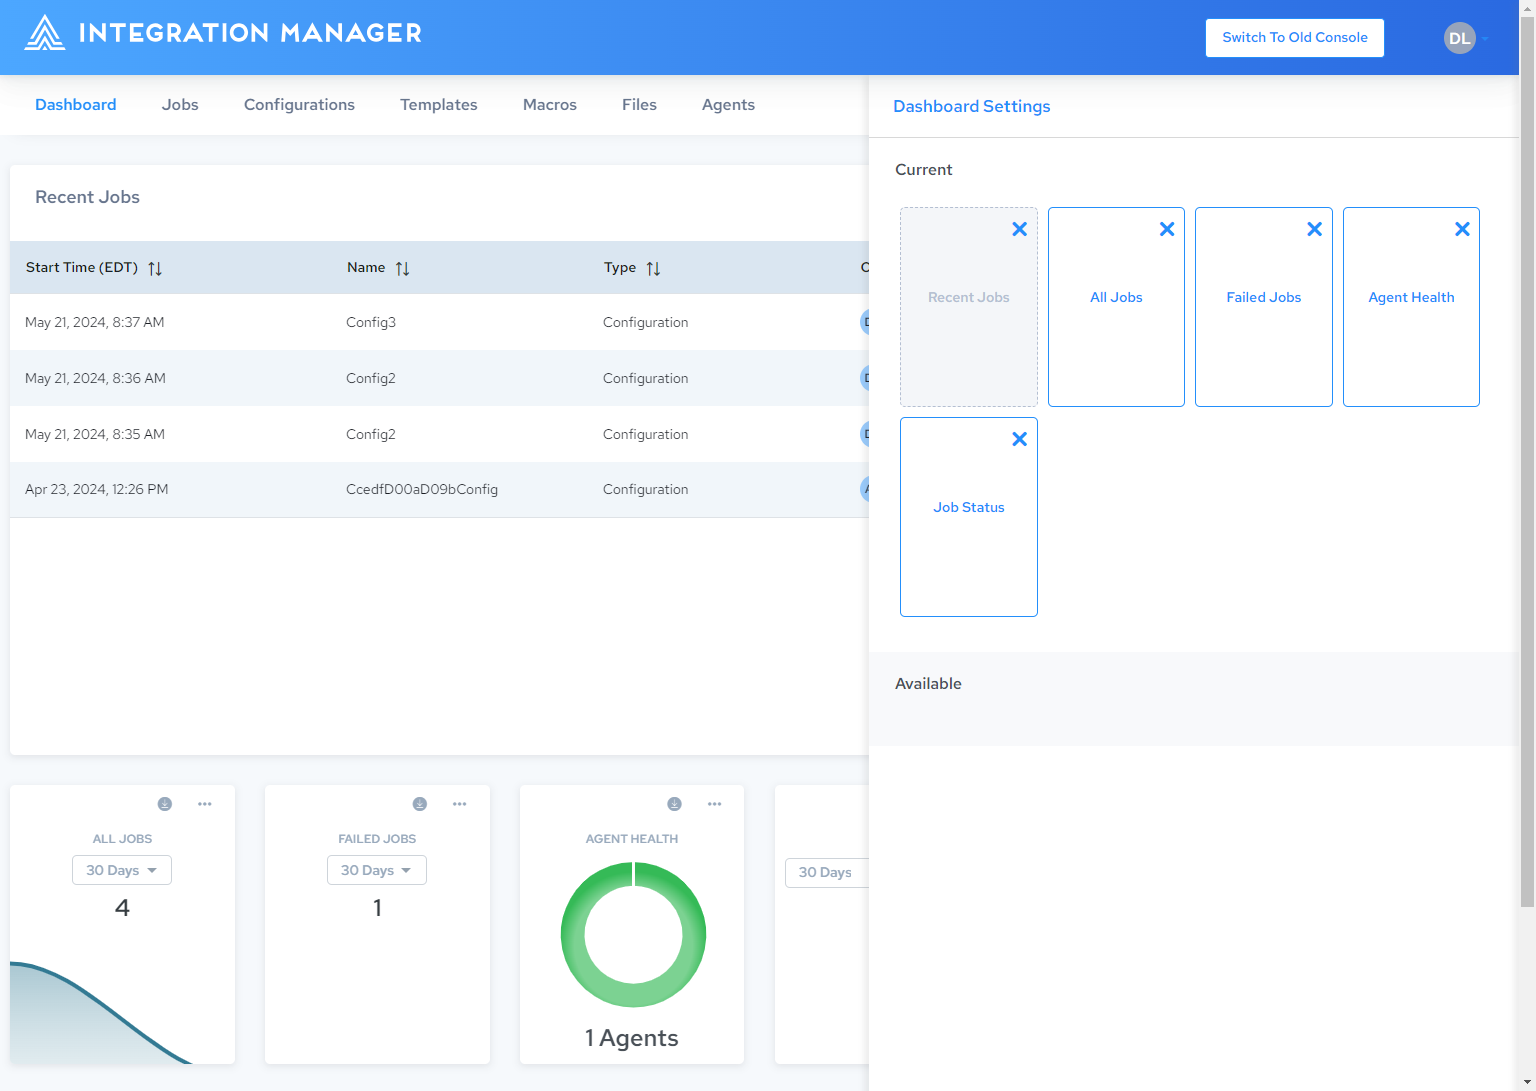
The Dashboard Settings panel is opened:
-
To remove a widget, click
 in the Current section. It will move to the Available section.
 -
To add a widget, click
 on a widget in the Available section. It will move to the Current section.
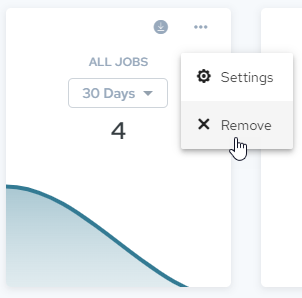
You can also remove a single widget by clicking ![]() on the widget and selecting Remove:
on the widget and selecting Remove:
Rearranging Widgets
To change the position of the widgets on your Dashboard, drag and drop the desired position. Settings are persisted the next time you log in.